The goal of this project is to practice writing programs that have a graphical user interface (GUI) and use graphics. This project will also tie together many threads from the course of the semester and will result in an impressive product you can show your friends.
You will write a program that operates as a graphing calculator. It will have a window that allows a user to enter in a function and set min and max values for x and y (to specify the viewing range); it will draw a graph of the function within the specified range.
The program I wrote to solve this problem looks like this:
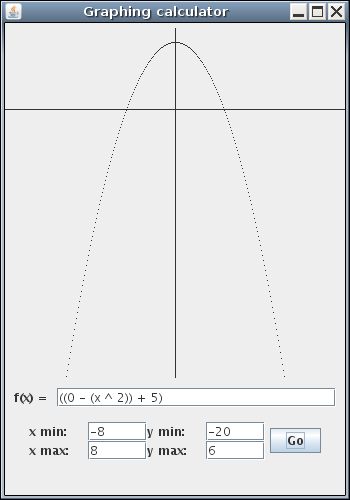
You are not required to mimic this window exactly, but your program should have a window with the basic features/elements found here.
Since time in the semester is running short, it is imperative that you decide on a schedule for yourself for working on this project. This project has three distinct parts:
What you need to know about these:
Copy the starter files from the course public directory:
cp /homes/tvandrun/Public/cs235/proj8/* .
The graphing calculator will graph functions whose bodies are defined by the following language:
expression --> integer |x| ( expression op expression)
op --> + | - | / | * | ^
Note there are two changes to the language from lab 11: the language now has variables (technically only one variable, x) and exponentiation. Remember/notice that the expression must be fully parenthesized and that there is no unary negation (ie, negative sign) in the language, so instead of
-3x^2 + 5
one must write
((0 - (3 * (x ^ 2))) + 5)
or
(((0 - 3) * (x ^ 2)) + 5)
(This might seem like an undue burden on the user, but
believe me that implementing things like order of operation,
implicit multiplication (ie, 3x),
and unary minus would make this project severely more difficult.)
You must model expressions in this language using trees just as in lab 11 and interpret strings in the language by building appropriate trees.
I have provided the ExprNode interface.
There is one difference between this and the version from lab 11:
the signature of the evaluate method is now
double evaluate(double x);
It returns a double (everything in this project will be double-valued, not int-valued), but more importantly, it also has a double parameter. This parameter indicates the value of the variable.
Your task is to write classes Number,
Variable, and Operation (or
similar classes; you don't have to use these exact names)
which will implement ExprNode.
They will be similar to those your wrote in lab 11.
The interesting part is figuring out how the evaluate()
method will differ.
(Hint: What will the various classes do with the
formal parameter x?
The Variable class is the only one that will
use it, the Number class will ignore it,
and the Operation class will pass it along
in the recursive calls.)
I have provided the class ExprStringSlicer
just as with lab 11; refer to that lab description to
see how it works.
The class Interpreter has a static method
interpret()
which will be used to convert strings to ExprNode trees.
Your task is to fill-in the method
interpret().
Hints:
interpret()
to build the subexpressions.
x, (,
or something else?
You can test it using the main()
method of Interpreter, giving
the expression (in quotes) and the x-value on
the command line, for example
java Interpreter "((0 - (x ^ 2)) + 5)" 3.5
Don't worry yet about handling erroneous input. At this point it is ok if your program crashed on unparsable text.
In this part, you will design and implement
the window that will be shown to the user.
The class GraphCalc has a main()
method which is the main method of the whole program,
and its primary purpose is to build the window.
I am providing for you a class called
PaintPanel which will make doing graphics
easier.
It is a component which you can include in the window;
it will be the space in the window where the graph appears.
More details of this class will be given in part 3.
Your task is to finish the main()
method of GraphCalc.
I have included the parts that need to be somewhere in the
window: JTextFields for the function and
the x and y min and max, a button, and a PaintPanel.
You may decide to rearrange these.
At any rate, you need to add them to the window,
plus any panels, layout managers, etc.
Don't worry about the fact that the window doesn't do anything. In this part, your only concern is the window's appearance.
Finally, you need to make a graph appear on
the PaintPanel whenever the button is pressed.
This will require a class that implements
ActionListener which is attached to the button
and triggers the graphing when the button is pressed
and a class that implements Painter
and draws the graph.
(In my solution, I wrote one class that does both-- it
implements both ActionListener and
Painter.
Its actionPerformed() method calls the
panel's repaint() method,
and its paint() method reads from the
JTextFields and does most of the work.)
Here are the things that need to be done whenever the button is pressed.
Graphics
class is in the upper lefthand corner.
This means that the y value -9 would correspond to
coordinate 190.
y
axis; if 0 is within the y range, then draw the x
axis.
Your task is to write a class or classes
that does this, and update GraphCalc
so that the new class or classes will interact with the
window.
Please email the files you wrote or changed to me.
DUE: Wednesday, Dec 9, at 5:00 pm.